REPORT BUILDER
Zuper's self service tool that allows users to create and customize their own enterprise reports without needing developer assistance.
Now
Live

Zuper is a SaaS product for Field Service. We help businesses manage their field operations efficiently by streamlining processes such as scheduling, dispatching, customer management, etc., We offer tools that allow companies to automate tasks, monitor field workers' activities, and improve overall operational productivity.
THE BRIEF
Earlier, we had a version of Reports that essentially was a set of templates with predefined columns.
Users can select a template, input the time range, set filters, and generate the report as an Excel document.

The major issue with this setup is that the templates aren’t customizable. Users can’t add new columns or remove existing ones. If customization is needed, clients have to submit a request, and developers customize the report through code. This process is time-consuming for both our team and the customers, and it’s not scalable.
To put it into perspective, our developers had built over 600 custom reports!
This showed us that there was a clear need for a tool that would allow clients to create & modify reports on their own, saving time for everyone involved. That realization led us to build the Report Builder.
With a self-service report builder, our developers could focus on more complex, technical tasks, while clients could get their custom reports without delay.
My role in this project was to research, ideate, and design the tool. The main goal was to create an interface that felt familiar to users so that even non-technical users could easily build custom reports.
TIRED OF READING?
Zuper is a SaaS product for Field Service. We help businesses manage their field operations efficiently by streamlining processes such as scheduling, dispatching, customer management, etc., We offer tools that allow companies to automate tasks, monitor field workers' activities, and improve overall operational productivity.
THE BRIEF
Earlier, we had a version of Reports that essentially was a set of templates with predefined columns.
Users can select a template, input the time range, set filters, and generate the report as an Excel document.
The major issue with this setup is that the templates aren’t customizable. Users can’t add new columns or remove existing ones. If customization is needed, clients have to submit a request, and developers customize the report through code. This process is time-consuming for both our team and the customers, and it’s not scalable.
To put it into perspective, our developers had built over 600 custom reports!
This showed us that there was a clear need for a tool that would allow clients to create & modify reports on their own, saving time for everyone involved. That realization led us to build the Report Builder.
With a self-service report builder, our developers could focus on more complex, technical tasks, while clients could get their custom reports without delay.
My role in this project was to research, ideate, and design the tool. The main goal was to create an interface that felt familiar to users so that even non-technical users could easily build custom reports.
TIRED OF READING?
GETTING STARTED


The starting point for this project was the PRD shared by Krishna, our Principal Product Manager. This PRD was put together based on market research, customer feedback, and data analytics.
For the design team, the PRD helps us understand the project scope, the main problems we need to solve, and the proposed solutions.
This also ensures that all teams involved are aligned and working toward a shared goal.

RESEARCH
I analyzed the current reports module to get a better understanding of the product. This helped me identify potential UX and design improvements.
To understand the types of reports being created and the level of customization involved, I spent several days with our Professional Services team. This team is the one responsible for implementing all our custom requests.
Also, I did a secondary research on findings by the PM & the data analytics team. From this, I was able to identify & define a few ways how one could use our report builder tool.
GETTING STARTED
The starting point for this project was the PRD shared by Krishna, our Principal Product Manager. This PRD was put together based on market research, customer feedback, and data analytics.
For the design team, the PRD helps us understand the project scope, the main problems we need to solve, and the proposed solutions.
This also ensures that all teams involved are aligned and working toward a shared goal.
RESEARCH
I analyzed the current reports module to get a better understanding of the product. This helped me identify potential UX and design improvements.
To understand the types of reports being created and the level of customization involved, I spent several days with our Professional Services team. This team is the one responsible for implementing all our custom requests.
Also, I did a secondary research on findings by the PM & the data analytics team. From this, I was able to identify & define a few ways how one could use our report builder tool.
FINDINGS

All the Reports aren't needed
Users do not typically use or view every available report. Instead, they focus on a select few reports that are relevant to their specific role and requirements


MS Excel & Spreadsheet
A common trend among our target users is that they use or have previously used spreadsheets to build reports. This means most users are already familiar with spreadsheet-based reporting and pivoting frameworks.

Senior Executives
Executives within the organization typically do not need to see every detail in a business report. Instead, they prefer summaries that provide an overview of current performance and key insights, which helps them in strategic planning and decision-making

Department Leads
A department lead in a client company would generate reports specific to their team or department. They would review individual data records and monitor trends to make informed decisions.
WIREFRAME
Since most of our customers are familiar with building reports in spreadsheets, we wanted to make the report-building experience in our product similar.
This way, the tool would feel familiar, and users wouldn’t have to spend time figuring out how to use it.
VERSION 1
The idea was to display all available fields in Zuper on the right side, allowing users to add them to the report with a simple click of ‘+’.
Users could also add formulas, conditional formatting, and other customizations.

We liked the idea that the right pane would handle all customizations, while the middle pane would show a table preview. But, there were a few issues in this version of the wireframe
To rearrange columns, I considered a straightforward solution inspired by spreadsheets. I wanted to allow users to horizontally scroll the table, and drag columns left or right.
While intuitive, this approach works best with only a few columns. Our data shows most reports have at least 10 columns, with some having up to 30, making this method cumbersome for extensive rearrangements
On the right pane, all available fields are listed, and users can simply check a box to add a field to the report. Like a typical checklist, checked fields move to the top of the list, while others remain accessible by scrolling.
However, as more columns are added, switching between added and available fields becomes tedious due to constant scrolling
To address these issues, we opted for two separate lists, one for available fields and another for added fields. This separation makes it much easier for users to manage and rearrange fields in the added list.
VERSION 972347293874465297469
After many rounds of feedback, testing, and iterations, we finalized the framework for the Report Builder, and this was our final wireframe

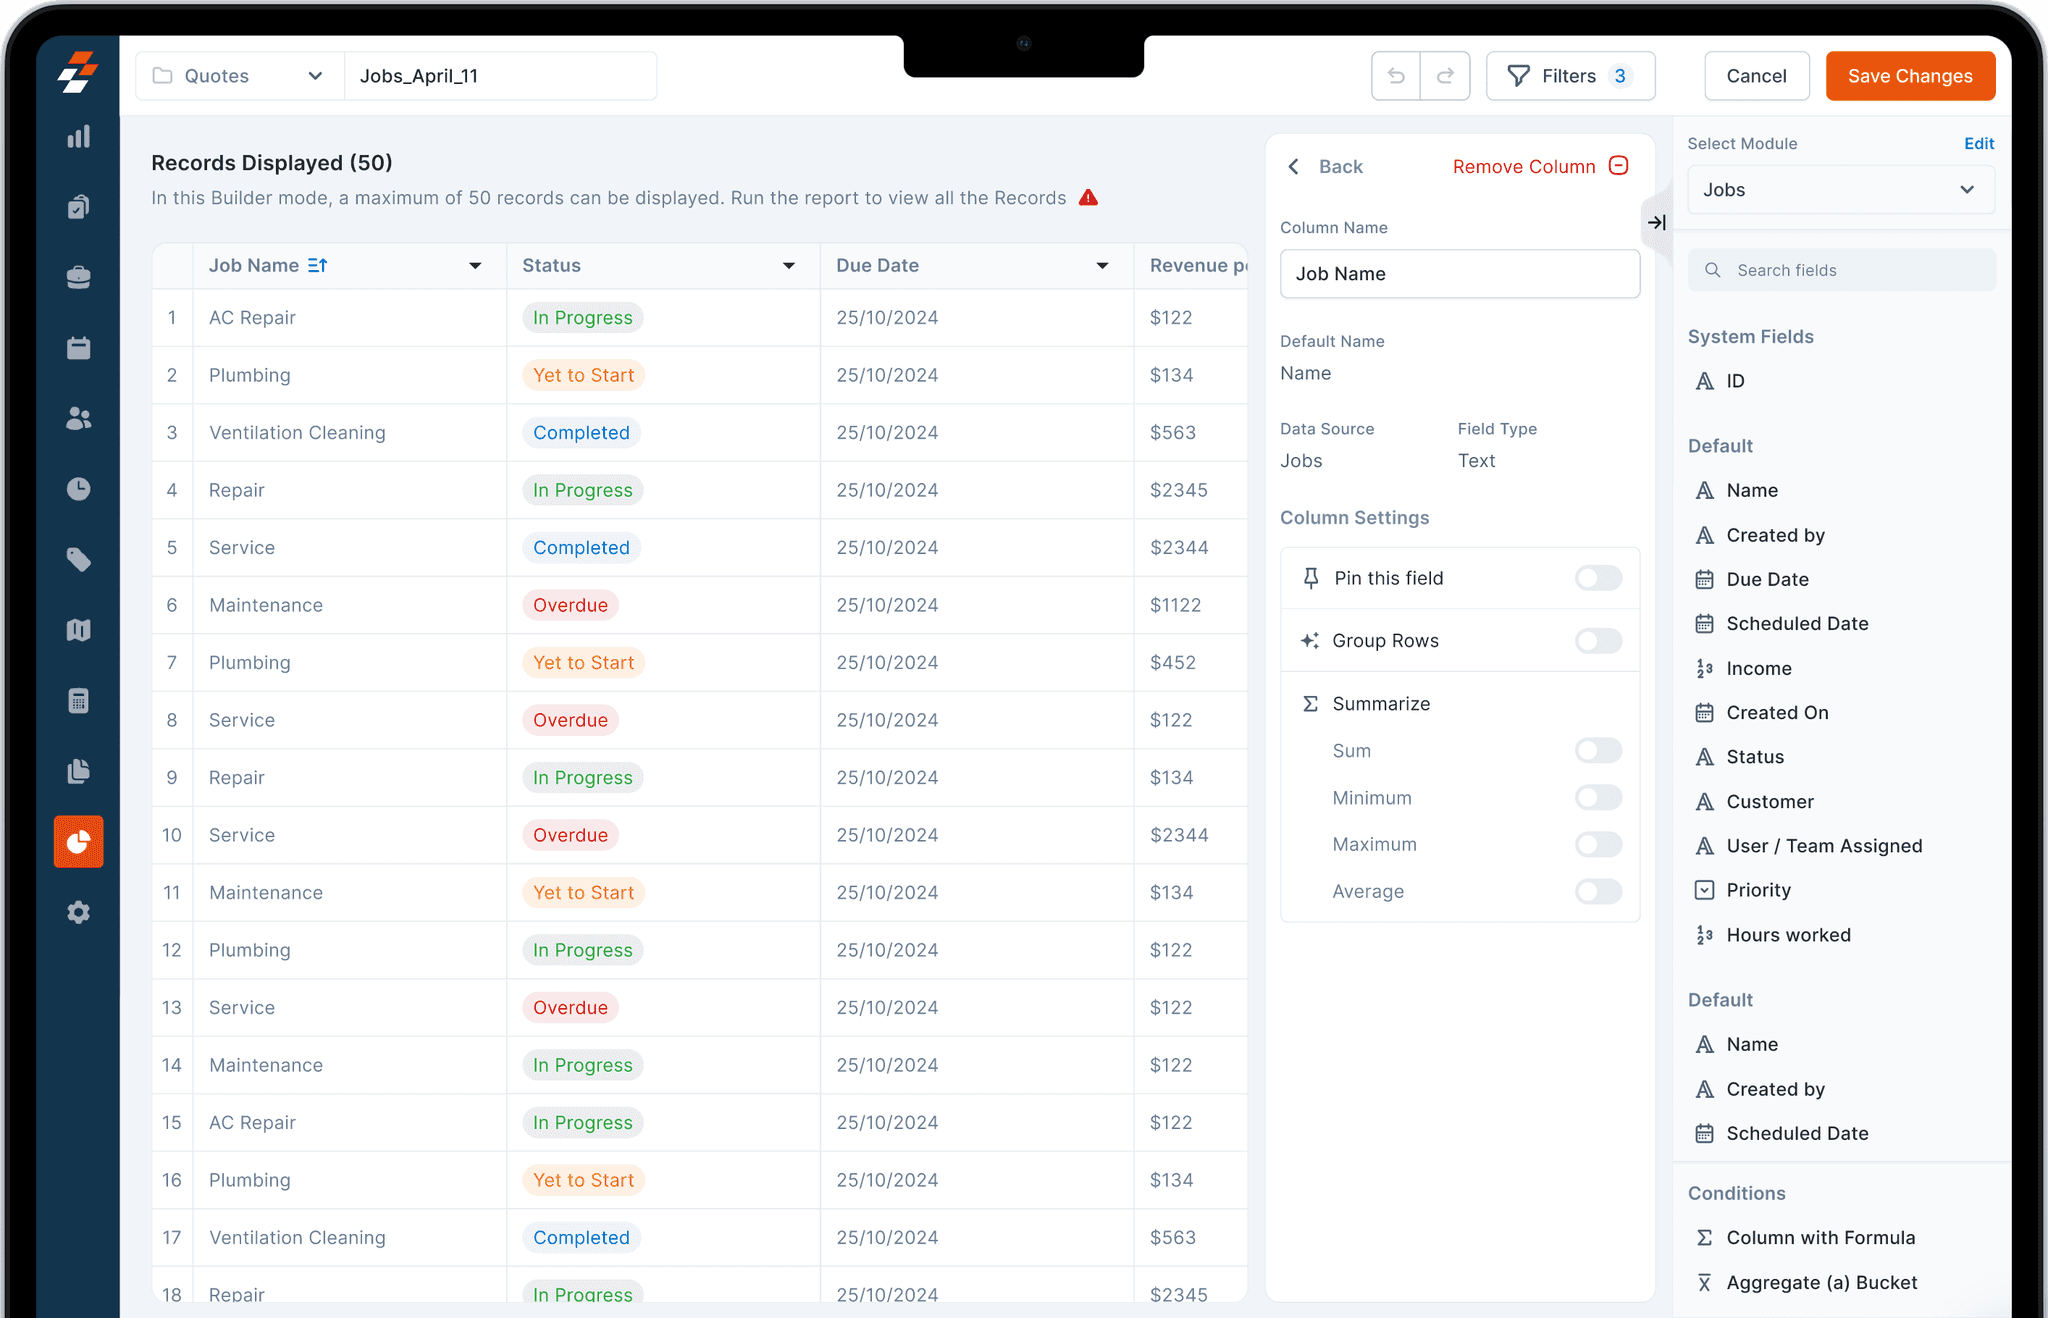
INTERFACE DESIGN


THE BUILDER
Report Builder is Zuper's first major tool that empowers customers to create something on their own. Being the first of its kind, I had the freedom of a blank canvas with no strict guidelines.
For this project, I designed a few components, interactions and patterns. Some of them are shown above

A NEW COLOUR TO OUR LIBRARY
Until now, we only had a single Surface BG token. But using the same colour everywhere made the design look flat. So, I introduced a slightly darker shade of white to our token library.
This sits between our surface and background colour


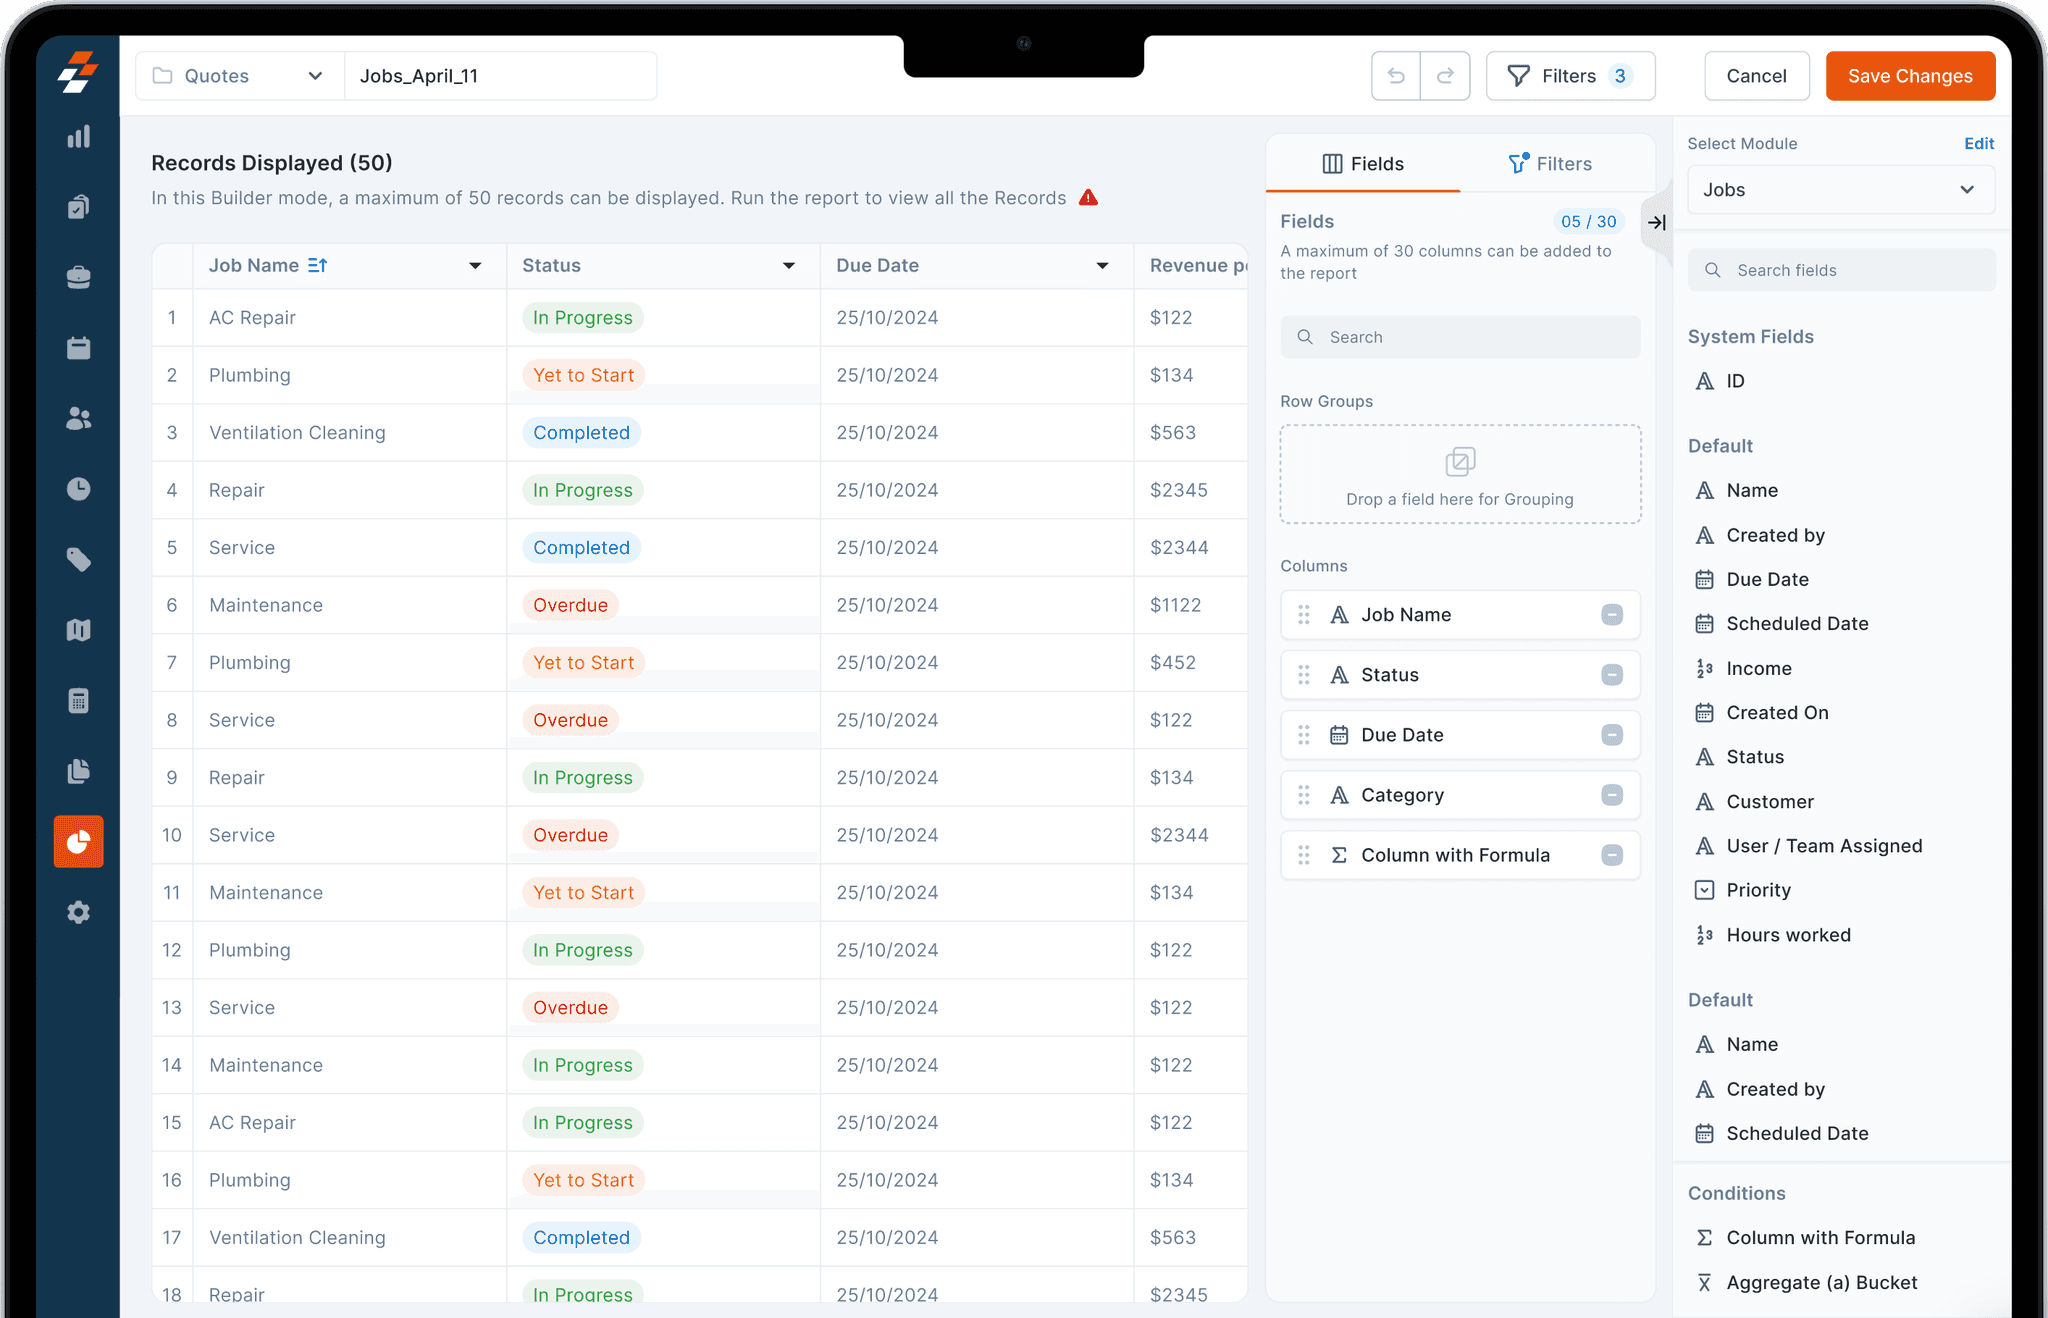
The first step is to choose between a Detailed Report or a Summary Report.
A Detailed Report lets users build reports with individual data records, where fields are added as columns. For example, you can create a report showing each service appointment, including details like customer name, job status, and technician assigned.

A Summary Report focuses on aggregated data, allowing users to add fields both row wise and column wise. For example, you can create a report showing the total number of jobs completed by each technician (rows) categorized by job type (columns).

This flexibility ensures users can tailor their reports to the level of detail and structure they need.
For those who prefer not to start from scratch, there’s a third option: Choose from Templates.
We’ve included a variety of templates based on common use cases to save time and simplify the process
After choosing the report type, the next step is selecting the Primary module, and upto 3 Secondary modules. These selections determine how the database will be populated for the report.

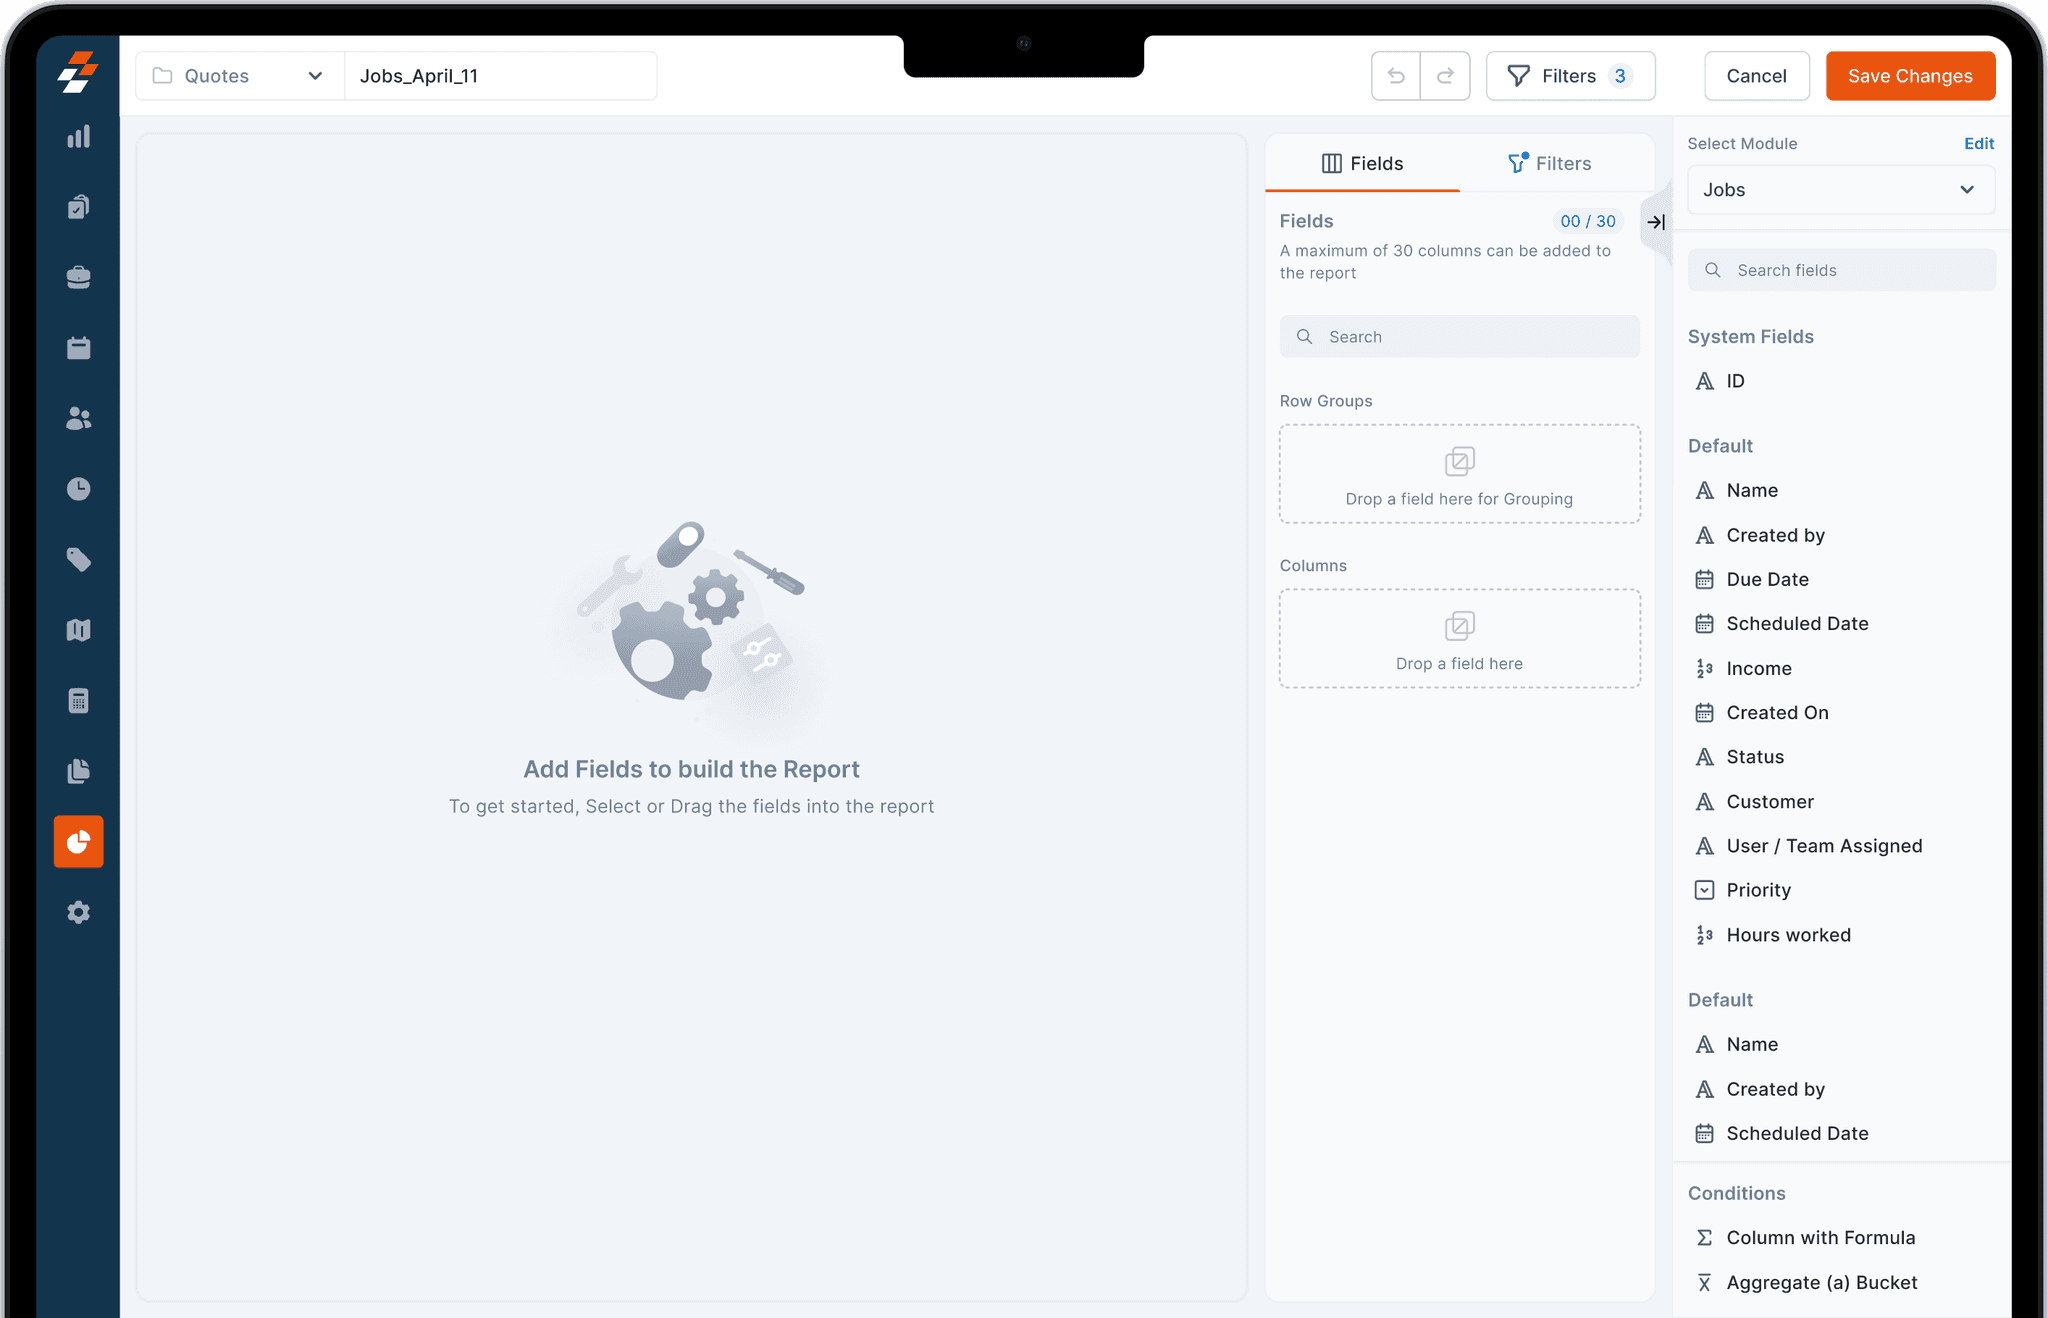
REPORT CREATION WIZARD
Empty state of the Builder page
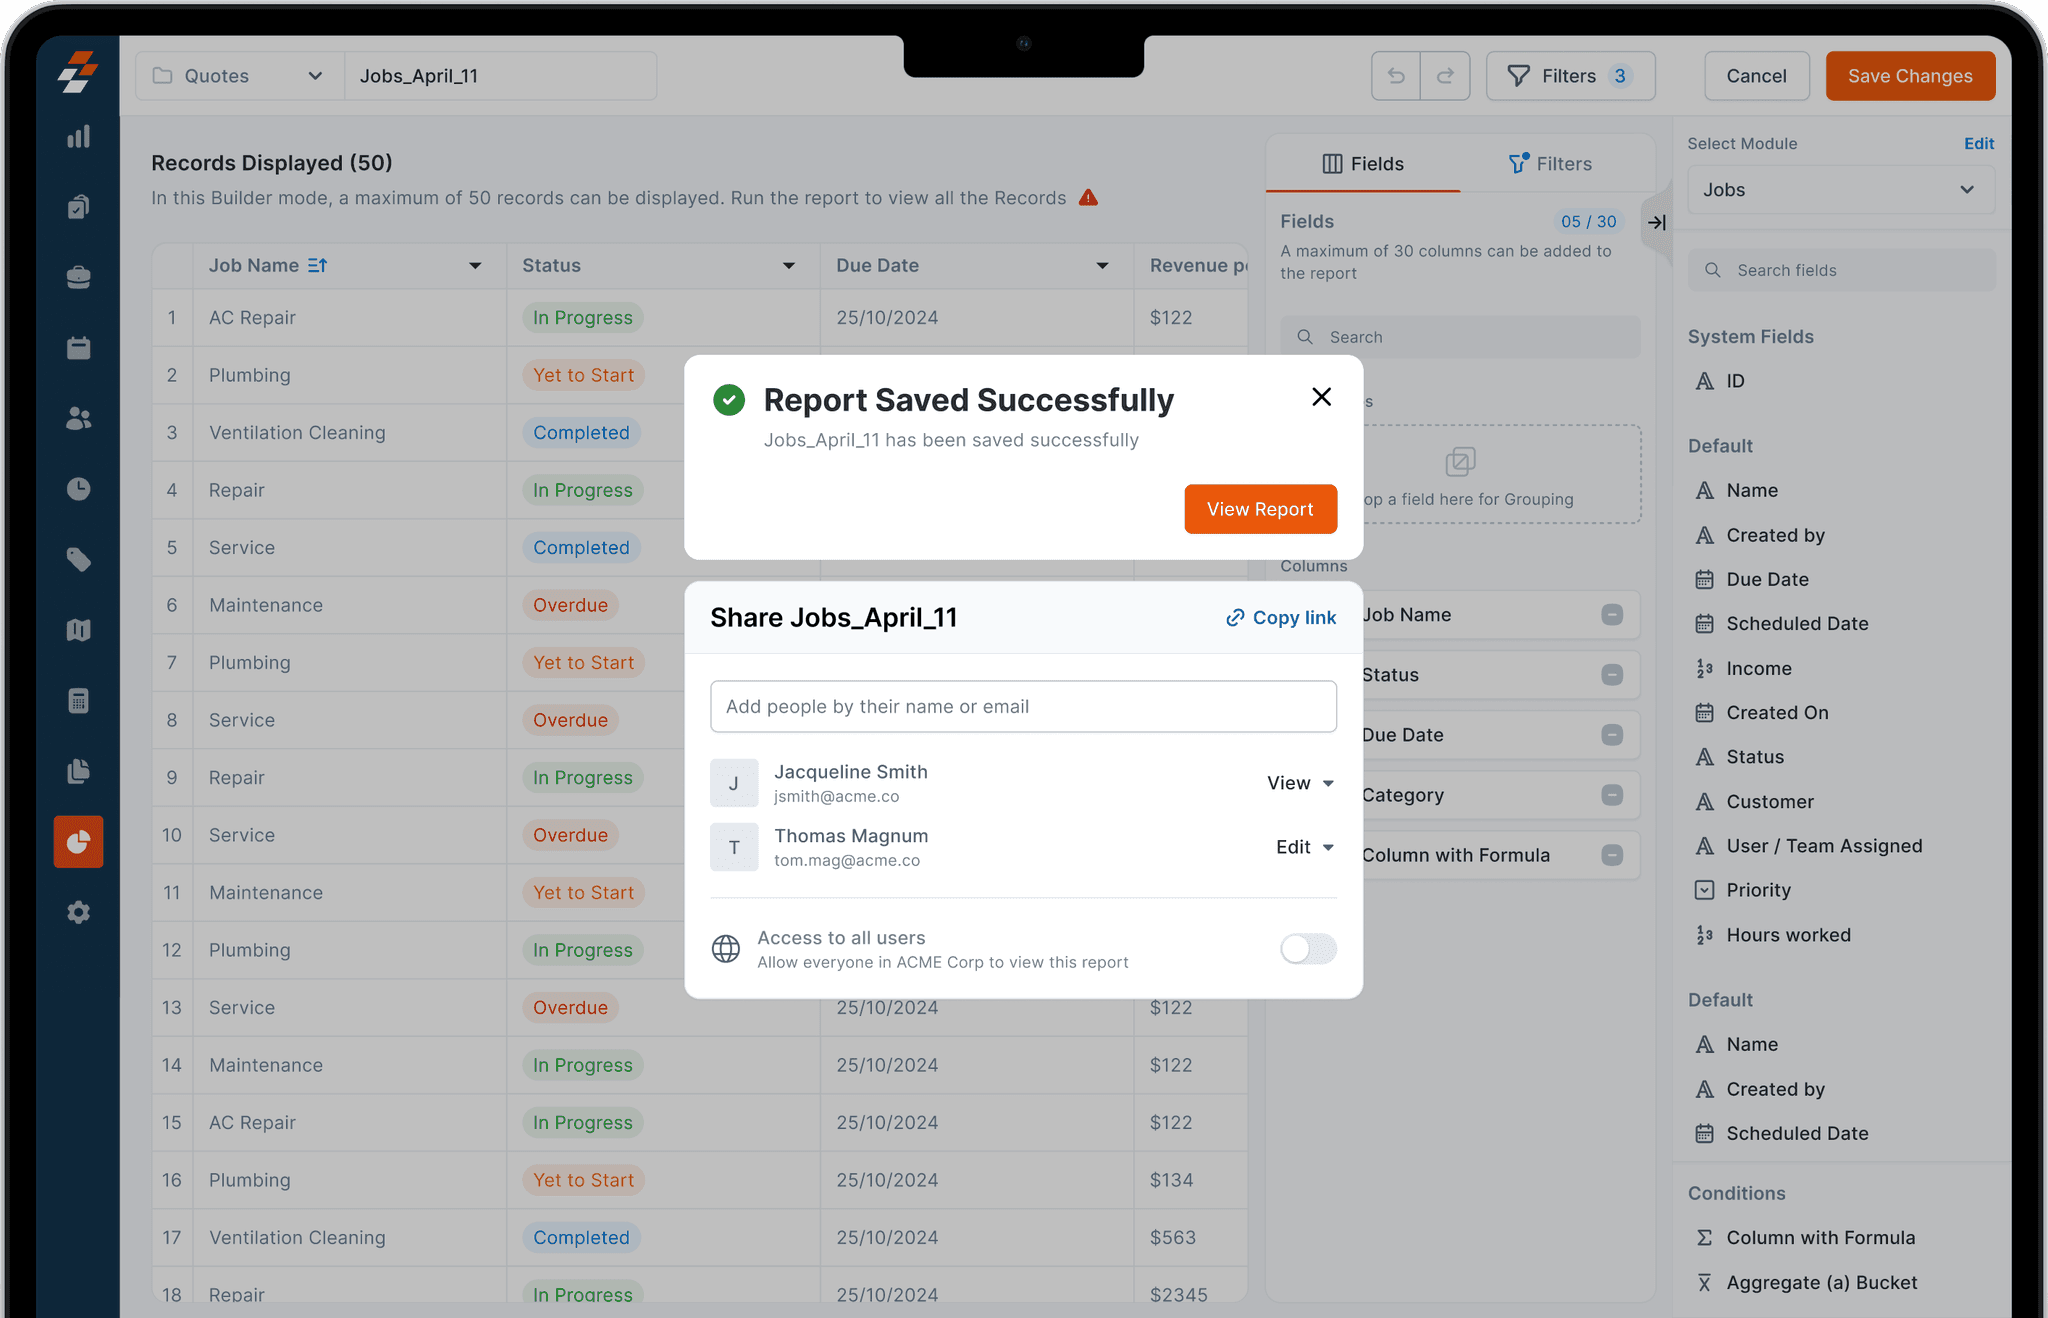
REPORT LISTING
I've built a Report. But where can I see it now?
The created reports are displayed in the Report listing page!
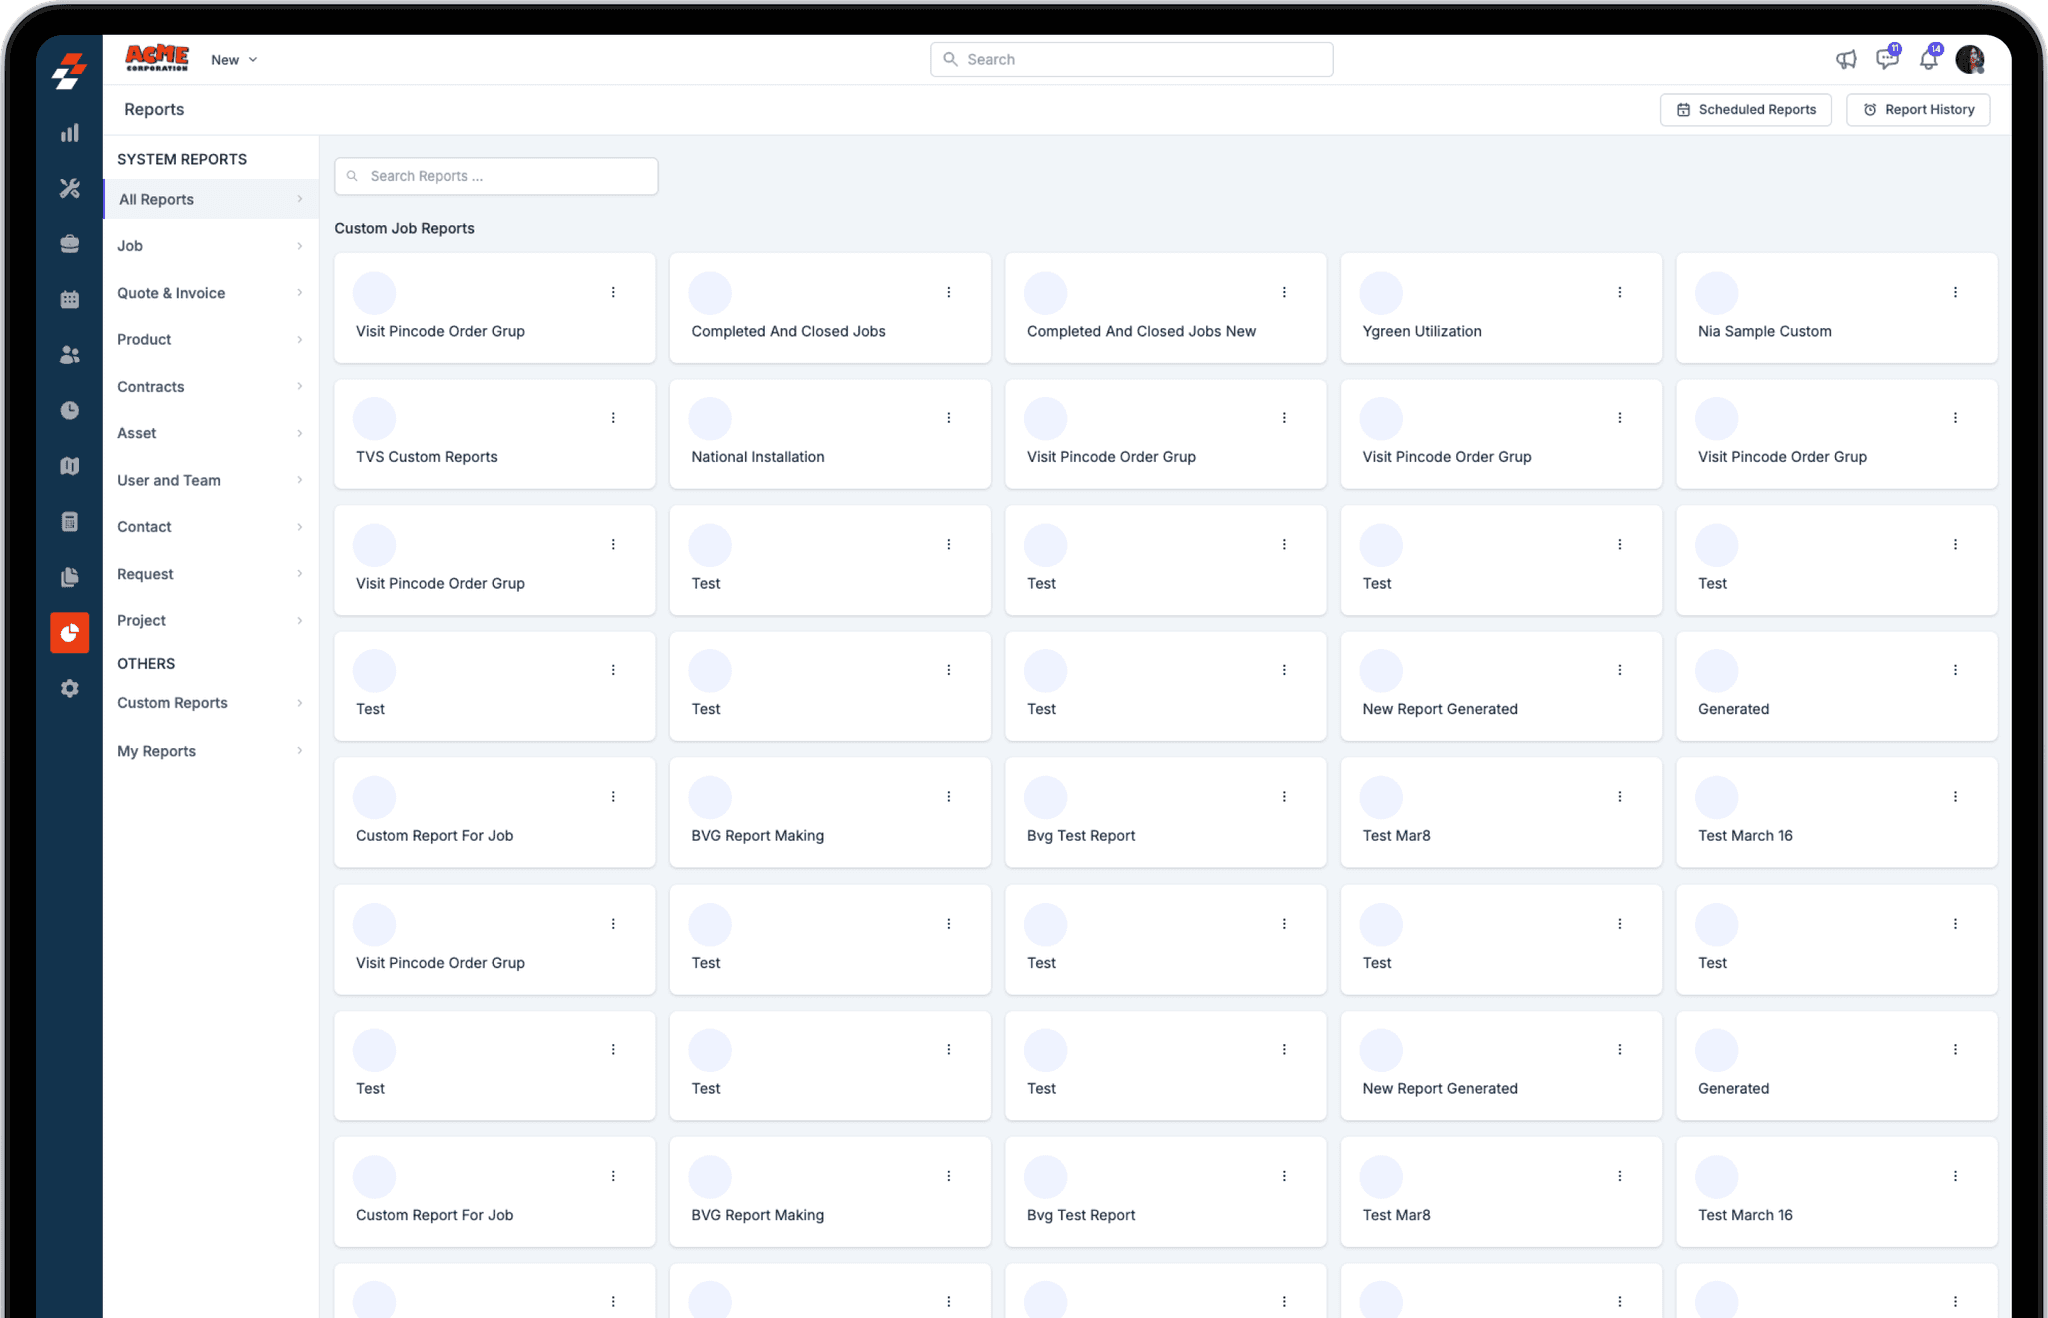
I was tasked with redesigning the Report Listing Page. In the current version, reports are organized just based on modules.
With new features being introduced, like the templates for report creation and the ability to share reports, we needed to rethink how reports are managed. Also, instead of sticking to the module based organization, we decided to give users more flexibility by allowing them to create folders. This way, they can organize their reports in a way that works best for them.
BEFORE
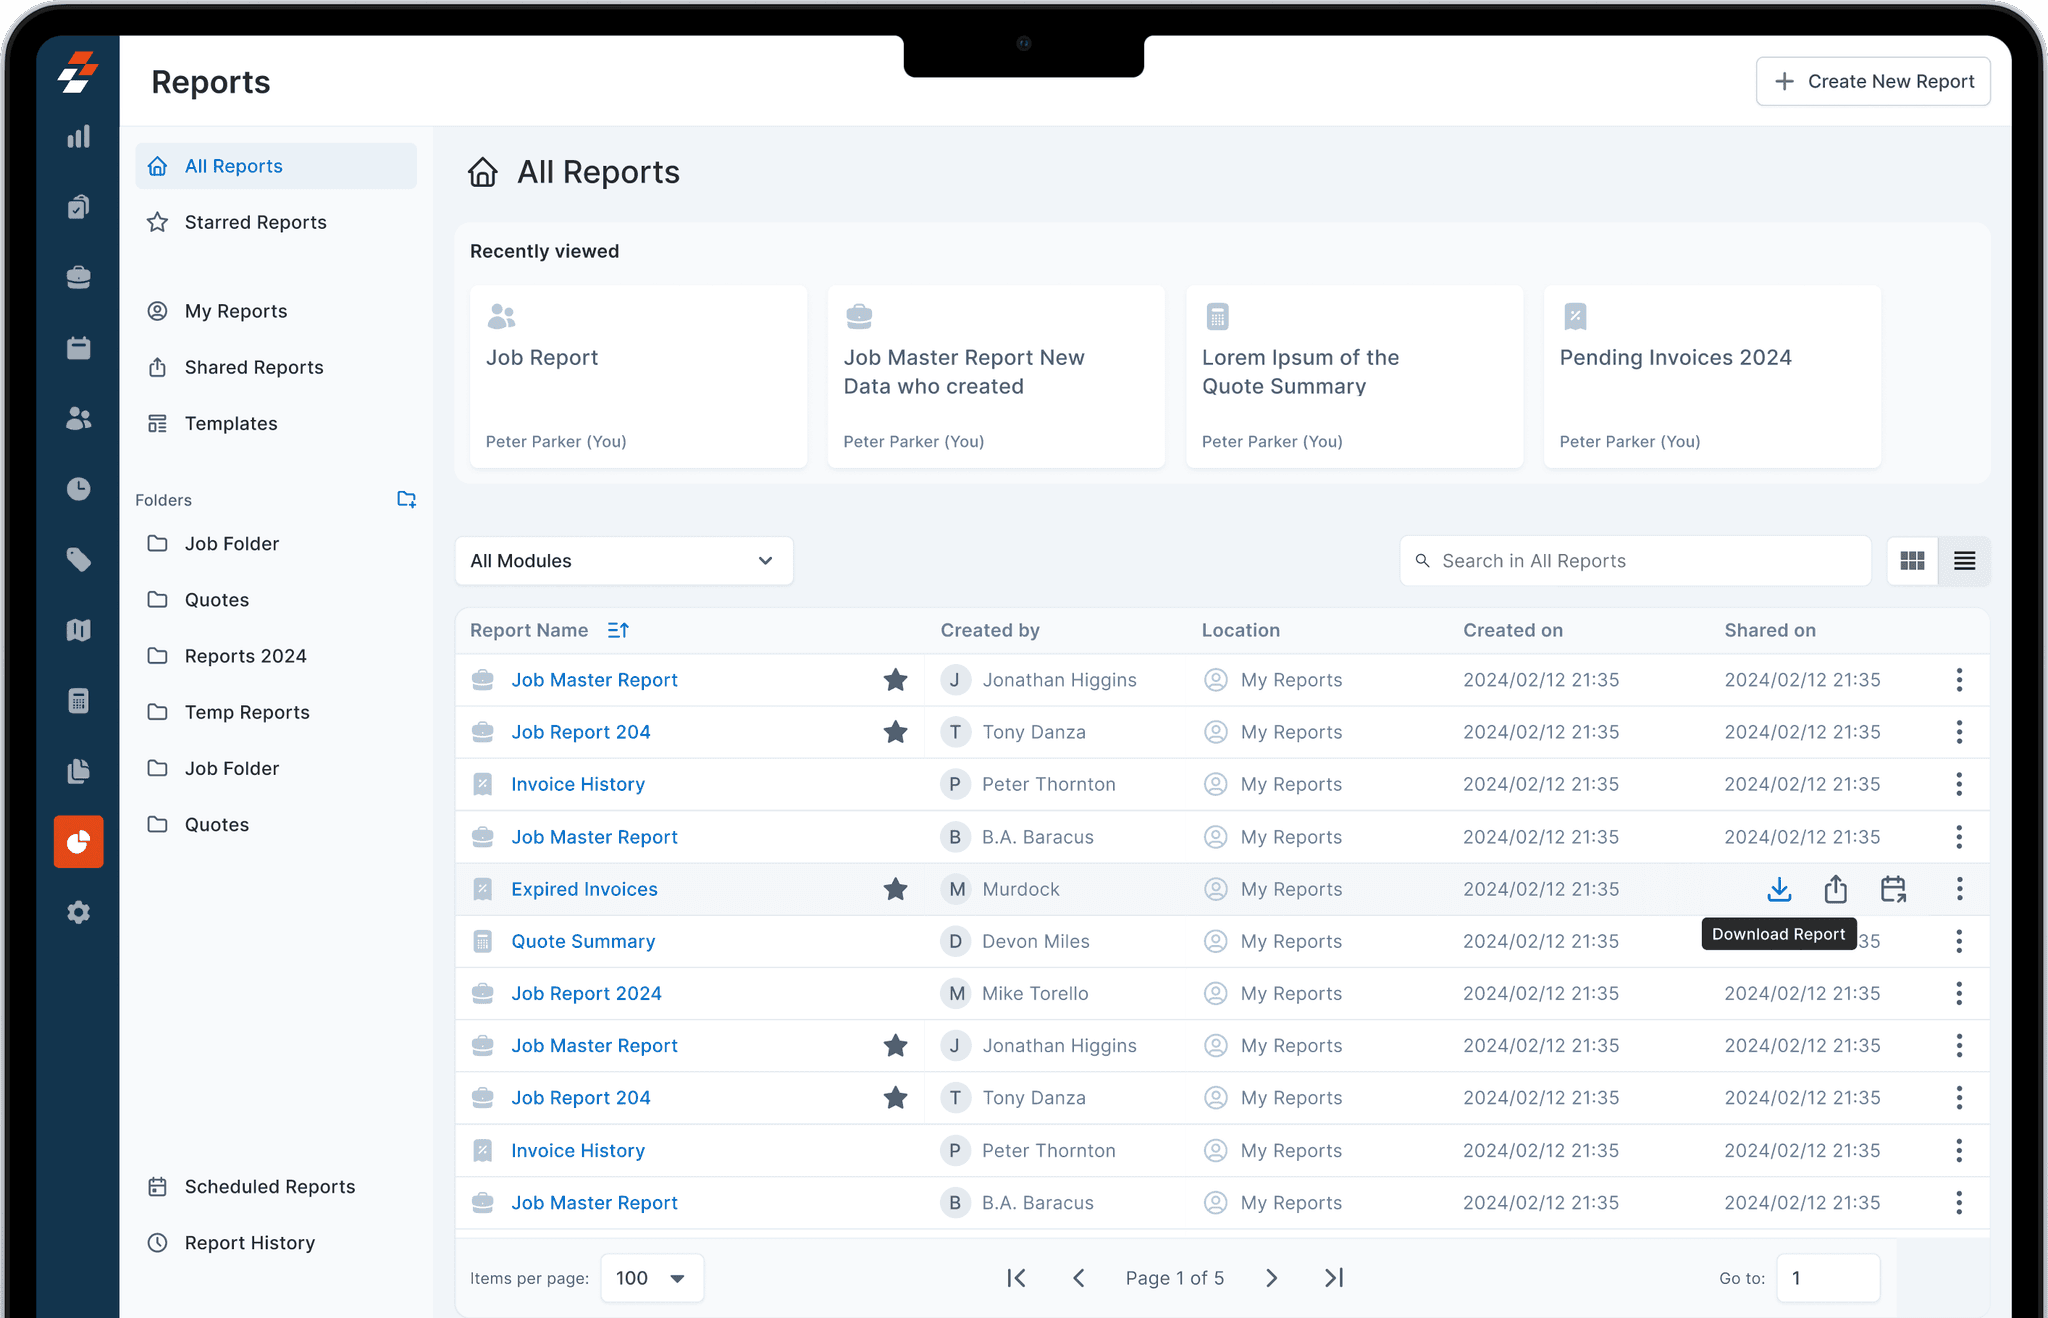
In the redesigned Side Nav bar, the reports are classified into two: My Reports & Shared Reports. Both of these are grouped together into All Reports.
As I mentioned earlier, the users can Create a Folder & add a report to it. This helps them organized the way they prefer
The listing page also includes a menu to explore templates. Users can browse templates by module or search for specific types of reports. Once they find a relevant template, they can easily customize it further using the Report Builder.


HANDOFF
Over 3 months, I worked closely with stakeholders to build this feature. From day one, the CTO, PM, engineers, and data analysts were a part of our ideation & feedback sessions
For internal testing, I built a hi-fi prototype in Figma using the advanced prototyping features.
We then tested the report builder with our users using Maze, which helped me refine some of the interactions.

ANNOTATED FIGMA FILE
Once the designs were finalized with stakeholder feedback and iterative testing, I prepared a detailed Dev handoff file.
This included detailed annotations on flows, component states, and responses, ensuring clarity for the development team. Hand off doesn't end with the Figma file. I collaborated closely with developers to address edge cases and refine interactions during the implementation.
In the Beta stage of the Report Builder, we tested it with the diverse use cases of the customers. We conducted usability testing sessions and feedback loops. The feedback helped us identify areas for improvement and to further validate the design assumptions
The team is closely monitoring metrics such as Time to Complete, Abandonment Rate, and User Engagement to understand how effectively users can build reports. These metrics guided the Beta phase, and now it helps us with insights for the future iterations.
This project taught me the importance of balancing flexibility and simplicity, especially for a feature that is designed for both technical and the non-technical users. It also reinforced the value of iterative testing and close collaboration with cross-functional teams.
Moving forward, the insights gained on this project will shape not only the Report Builder, but also how we approach similar complex features at Zuper


THANK YOU!

WORK IN
PROGRESS
MOBILE VERSION
Please try this site in your Desktop for the best gaming experience
aksho.co